Tableau(Histograms in Tableau)
Histogram:
Connect to the Sample - Superstore data source.
Drag Quantity to Columns.
Click Show Me on the toolbar, then select the histogram chart type.


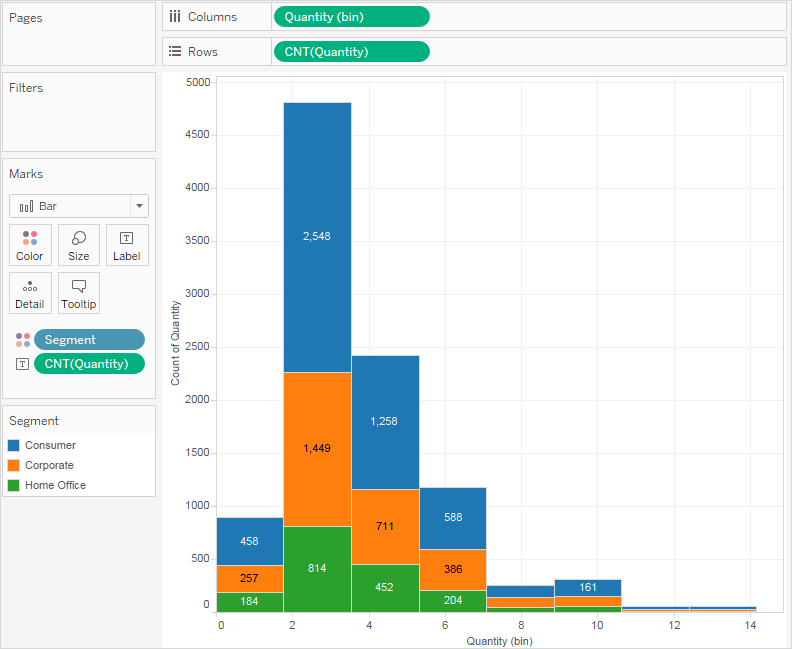
Drag Segment to Color.

The colors don't show a clear trend. Let's show the percentage of each bar that belongs to each segment.
Hold down the Ctrl key and drag the CNT(Quantity) field from the Rows shelf to Label.

Right-click (Control-click on a Mac) the CNT(Quantity) field on the Marks card and select Quick Table Calculation > Percent of Total.

But we want the percentages to be on a per-bar basis.
Right-click the CNT(Quantity) field on the Marks card again and select Edit Table Calculation.
In the Table Calculation dialog box, change the value of the Compute Using field to Cell.

Now we have the view that we want:

Comments
Post a Comment