Tableau (highlight tables in tableau)
Highlight Tables
- The highlight table allows us to use conditional formatting to a view of a normal table.
- Tableau will automatically apply a color scheme in either endless or stepped array of colors from highest to lowest.
- It’s great for comparing a field’s values within a row or column.
- Use highlight tables to match categorical data using color.
- Highlight tables are often outstanding as they help users quickly spot the foremost interesting values during a table of numbers.
- In cases where multiple variables are displayed, Measure Values are often used to apply one color scheme to all or any of the values in a table.
- Unless the variables are very similar, highlighting multiple variables is typically not helpful and can mislead.
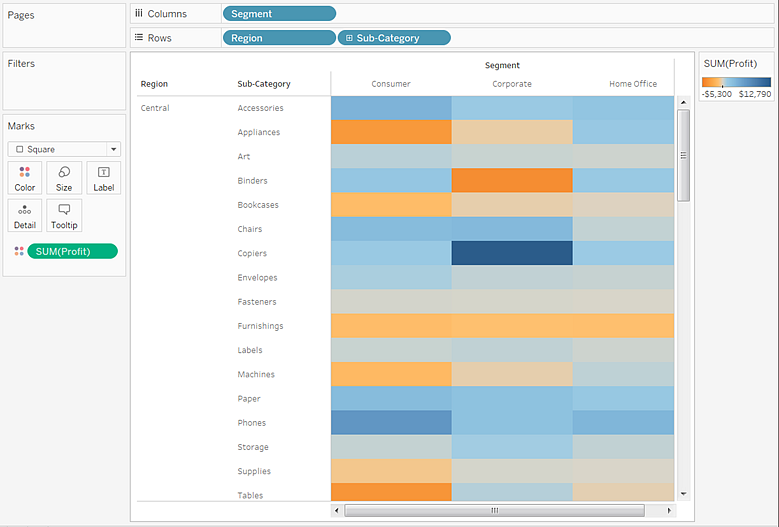
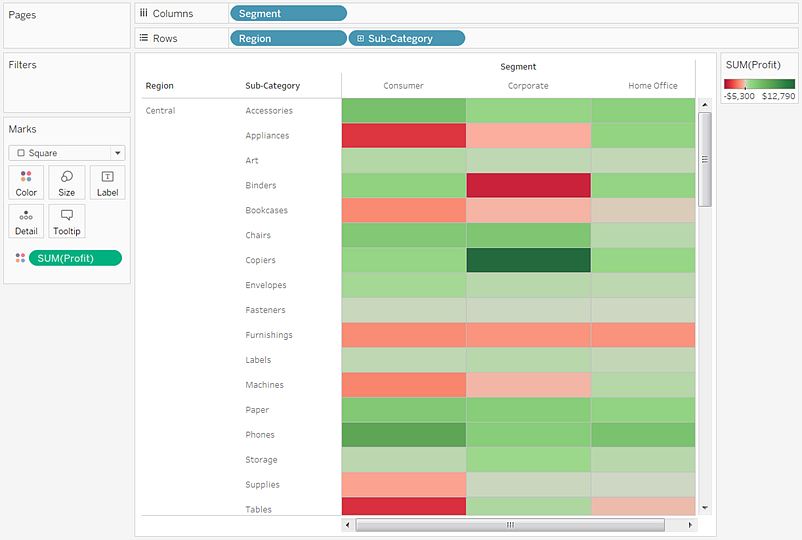
Connect to the Sample - Superstore data source.
Drag the Segment dimension to Columns.
Drag the Region and Sub-Category dimensions to Rows, dropping Sub-Category to the right of Region.
Drag the Profit measure to Color on the Marks card.
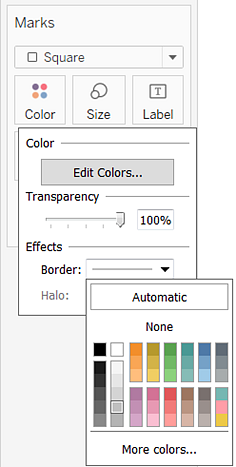
Click Color on the Marks card to display configuration options. In the Border drop-down list, select a medium gray color for cell borders, as in the following image:
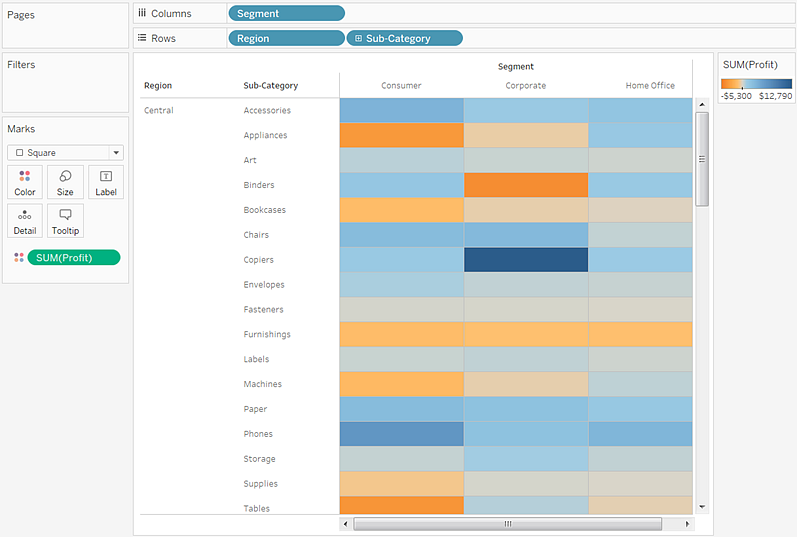
Now it's easier to see the individual cells in the view:
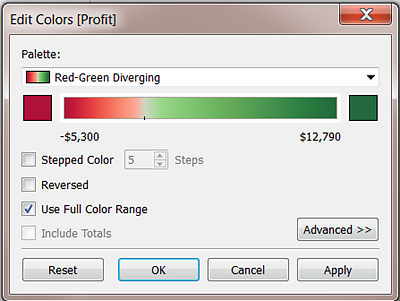
The default color palette is Orange-Blue Diverging. A Red-Green Diverging palette might be more appropriate for profit. To change the color palette and to make the colors more distinct, do the following:
Hover over the SUM(Profit) color legend, then click the drop-down arrow that appears and select Edit Colors.
In the Edit Colors dialog box, in the Palette field, select Red-Green Diverging from the drop-down list.
Select the Use Full Color Range check box and click Apply and then click OK.
Output


Comments
Post a Comment